![]()
![]()
![]()
A parallel development in geographic information science has been the recognition of the central role played by hierarchy theory. Hierarchy theory has implications for spatiotemporal information systems and analyses from a variety of perspectives: as an organizing principle for the understanding of complex systems (Pattee 1973, Simon 1973), to explain the differences that exist at different levels of analysis (Ahl and Allen 1996) and in the cognition of space and spatial information (Golledge and Montello 1998).
Current trends in GIS and spatiotemporal information systems have been moving towards the integration of flexible data representation and manipulation capabilities of database management systems and the spatial analysis functionality of GIS (Kafatos 1999, Kineman 1993, Kucera 1999). This paper highlights the following consequences of this trend:
These ideas have been further elaborated by Ahl and Allen (1996) proceeding along similar lines of thought. They contend that the dynamics of complex systems such as environmental and ecological ones can be explained by considering the different hierarchies that pertain within and between the entities that comprise the system. Depending on the problem being considered, a single material system may require a different level of explanation for each scale and type of measurement. Hierarchy theory encompasses both the role of the observer and the process of observation in scientific discourse thus accommodating multiple perspectives.
As far as measurement and observation protocols are concerned, it is important to differentiate between related concepts of grain and extent, which determine the spatial and temporal limits of the observations. The grain or resolution determines what entities are accessible to the observation process. On the other hand, the extent determines the span of the sampling process in the spatial and temporal dimensions. The data collection process thus involves competition between detail and scope. These notions are intimately linked to the more familiar notion of scale in geographic information science; both resolution and extent determine scale and scale may be spatial and/or temporal. In the temporal dimension scale is equivalent to the frequency of behaviours of the entities being considered. Examples in the next subsection illustrate the relevance of these concepts to geographic phenomena in environmental systems.
According to Ahl and Allen, entities may be definitional, those that are postulated before measurements are made, or empirical, those that are observed and measured as part of the observation process. Definitional entities are scale and rate-independent but may be modified by the empirical entities discovered through the observation process. Furthermore, as Pattee states, the notion of categories of entities are aspects of the researcher building interpretive models of the problem domain. Gray (1997) argues that the problem of classification in geography is fraught with problems and suggests a disaggregate approach to dealing with complex categories. From the computational point of view, these notions map into common hierarchical data representations. Hirtle (1995) suggests that trees, ordered trees and semi-lattices may be used to represent the cognitive aspects of spatial knowledge.
The notion of interaction between levels is of particular interest in hierarchy theory. The multiple levels may be structurally and functionally ordered into nested or non-nested hierarchies. Both types of hierarchies exhibit characteristics that relate upper levels of the hierarchy to those at the lower level; the upper levels behave at lower frequencies, provide context and thereby constrain lower levels in the hierarchy. In addition, nested hierarchies exhibit the additional characteristic of containment or inclusion. Thus nested systems are determinable from knowledge of their components. Nested systems occur naturally in the spatial dimension (Car 1998, Timpf and Frank 1997). In addition, Timpf (1999) describes generation of different types of hierarchies depending on the abstraction mechanism used. Of these, the hierarchy generated by generalization/specialization abstractions is a nested one. It should be noted that hierarchies are powerful exploratory devices for reasoning about the structure and processes that characterize geographic phenomena (section 2.2).
A commonly used heuristic for ordering hierarchical levels is according to the spatial and temporal characteristic frequencies of the empirical entities. Alternatively, levels can be conceptualized as information flows or filters. Filters attenuate, delay or integrate input signals between levels. In other words, filters inform categories (equivalent to categorization mapping functions as discussed in section 5). A natural counterpart to filters is that of surfaces. Filters identify successive levels, the hierarchical structure of which is reflected in a set of surfaces. Thus, the structure of (nested) hierarchies is represented by a set of surfaces surrounding more local surfaces within. For example, Varma (1999) proposes building multiple, hierarchically
related representations of spatial objects using HHCodes. These multidimensional codes enable fusion and interrelation of spatially referenced data using interlocking cells that are generated by aggregation techniques to form surfaces (or higher dimension structures).
Another geoscientific domain that is very dependent on hierarchical representation and analysis is that of biodiversity research (Stoms and Estes 1993, Stoms et al 1996). Biological surveys and monitoring of species distributions reveal distribution patterns that vary as a function of space-time scale. Both inductive and deductive models have been derived to predict the spatial locations of specific species and the environmental attributes of those locations. Observed data sets are sensitive to, and therefore have to be analyzed with reference to the extent, grain and sampling intensity of the spatial and temporal dimensions. A major challenge is to be able to generalize sparse observation data collected at fine spatiotemporal resolutions.
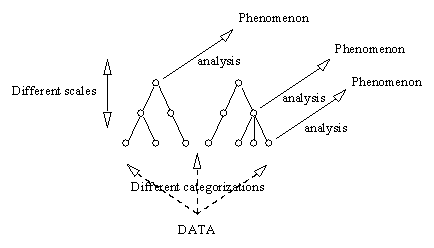
Figure 1. Hierarchical reasoning: scale and categorization affect analysis
Figure 1 expresses a high level conceptual view of the rationale underlying the framework. The system enables the exploratory analysis of geographic phenomena using spatiotemporally referenced observational data sets. The framework:
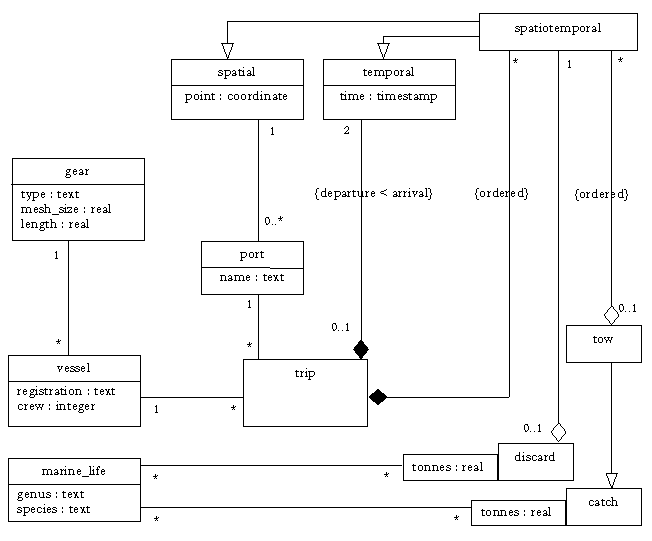
Figure 2. Conceptual Model of fisheries observational data
The main attributes of interest are catch and discards, which are organised according to their respective tows/trawls, time, marine species, vessel, gear and port of origin. Tow trajectories are recorded by periodically sampling a GPS. A general-purpose data repository such as this one is used by various groups with different objectives. The phenomena of interest include analyses of ‘catch surfaces’ by species, temporal range and so on. Measures of interest in the multidimensional problem space include aggregates, counts, averages, or CPUE (catch per unit effort) which may be calculated using a variety of attributes and formulae. Variations in the temporal dimension may be used to elicit trends in total catch or individual species or any combination of categories of species, changes in the spatial distribution of areas fished and level of activity by port of departure. It may also be useful for fisheries scientists to investigate the average length/time per tow/trawl by species, time of year, fishing area and so on. It should be noted that the spatial attributes may be in vector format (coastlines, trawl trajectories etc.) or in gridded format to represent surfaces of required multidimensional measures.
As noted in section 2.2 the spatiotemporal scales may vary and be composed of hierarchies of dimensions. For example, the gridded surfaces may be aggregated at varying cell resolutions perhaps depending on the distance of the fishing area from the shore (on the assumption that fishing activity is more intense in inshore rather than offshore areas). Alternatively, areas of interest may be designated fishing areas or identified spawning grounds, represented in vector format.
Likewise, the temporal dimension may be represented by a points in time, temporal intervals, sequencesof temporal intervals or functionally determined temporal intervals (for example the temporal designation ‘spring’ could be interpreted using a function with spatial arguments). The point to note is that as far as the multidimensional view of data is concerned, the space and time attributes are represented by identifiers or nominal index values. The aggregation and disaggregation operations on these attributes require special spatiotemporal mapping functions and cannot be aggregated using standard statistical/numerical operators. This is illustrated in section 5 below.
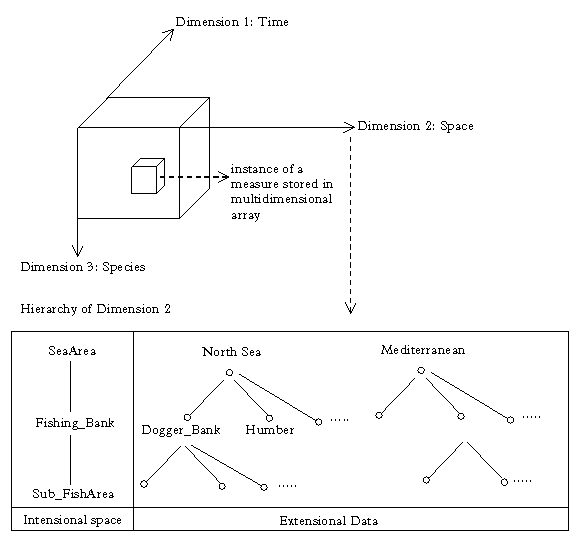
Figure 3. Example of an MDA and a dimension hierarchy
A dimension hierarchy H is a partial ordering
of dnodes, ![]() in
increasing coarseness of scale, organised according to one or more paths:
in
increasing coarseness of scale, organised according to one or more paths: ![]()
![]()
The term V or u is used to denote the node or vertex
of a hierarchy. Each dnode v
is also associated with a domain of
elements. A dimension path is a linear totally ordered list of dnodes, ![]() All the occurrences of a dnode in a single path must be unique, although
a dnode may partake roles in several different paths. Finally, every adjacent
vertex pair in a path denoted by the precedent symbol
All the occurrences of a dnode in a single path must be unique, although
a dnode may partake roles in several different paths. Finally, every adjacent
vertex pair in a path denoted by the precedent symbol ![]() is also associated with a partition mapping function:
is also associated with a partition mapping function: ![]()
![]()
The partition mapping function ![]() is a special case that defines the mapping of the dnode with the finest
granularity in each path to the query data set domain(s). An example can
help clarify the definition above: time is defined as a partial ordering
of dnodes V = {day, week, month, quarter, year}. This contains
two dimension paths:
is a special case that defines the mapping of the dnode with the finest
granularity in each path to the query data set domain(s). An example can
help clarify the definition above: time is defined as a partial ordering
of dnodes V = {day, week, month, quarter, year}. This contains
two dimension paths: ![]() =
(day
=
(day ![]() month
month ![]() quarter
quarter ![]() year)
and
year)
and ![]() =
(day
=
(day![]() week).
The domain of elements for ‘month’ is ‘January’, ‘February’, etc. The mapping
week).
The domain of elements for ‘month’ is ‘January’, ‘February’, etc. The mapping ![]() categorizes data record timestamps according to daily intervals. Once
a dimension hierarchy is defined, it is meant to be reusable in different
queries and contexts. This helps provide a common frame of reference when
different client applications refer to a particular aggregation scale.
Note that a dimension hierarchy is not complete.
categorizes data record timestamps according to daily intervals. Once
a dimension hierarchy is defined, it is meant to be reusable in different
queries and contexts. This helps provide a common frame of reference when
different client applications refer to a particular aggregation scale.
Note that a dimension hierarchy is not complete.
The partition mapping, or categorization function is defined as:
![]()
where, ![]() is the categorization mapping function,
is the categorization mapping function, ![]() are
the parent and child dnodes respectively, i.e.
are
the parent and child dnodes respectively, i.e.![]() .
For example, ‘month’ is the parent of ‘quarter’. Child nodes derive
aggregates from their parents, so child nodes are coarser in scale. Note
that m is a two-way mapping, thus enabling operations to traverse
up or down a hierarchy.
.
For example, ‘month’ is the parent of ‘quarter’. Child nodes derive
aggregates from their parents, so child nodes are coarser in scale. Note
that m is a two-way mapping, thus enabling operations to traverse
up or down a hierarchy.
A categorization function m maps each and
every element from the domain of ![]() to one or more elements in the domain of
to one or more elements in the domain of ![]() .
Although
m is defined as a bidirectional mapping between the two
dnodes, it is more accurate to distinguish between them. Therefore,
.
Although
m is defined as a bidirectional mapping between the two
dnodes, it is more accurate to distinguish between them. Therefore, ![]() is taken to mean the mapping from child to parent,
is taken to mean the mapping from child to parent, ![]() while m implies the parent to child mapping
while m implies the parent to child mapping ![]() .
That m has two definitions should not cause any ambiguity since
their connotations are context dependent, and the correct application should
be obvious — in any case, the explicit definition can be specified. Categorization
functions reflect a one-to-many
relationship between the parent
and child domains with respect to a given path. This means that each element
in the child is associated with one or more parent cells (aggregation),
and each parent cell is associated with one child cell. Parent dnodes may
partake in several paths, each with its own relationships. The mappings
are also complete, in the sense that every element is associated with at
least one element in the other domain.
.
That m has two definitions should not cause any ambiguity since
their connotations are context dependent, and the correct application should
be obvious — in any case, the explicit definition can be specified. Categorization
functions reflect a one-to-many
relationship between the parent
and child domains with respect to a given path. This means that each element
in the child is associated with one or more parent cells (aggregation),
and each parent cell is associated with one child cell. Parent dnodes may
partake in several paths, each with its own relationships. The mappings
are also complete, in the sense that every element is associated with at
least one element in the other domain.
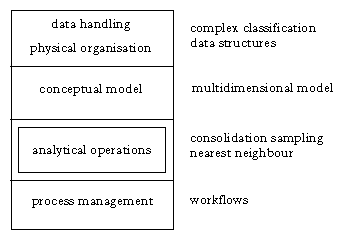
Figure 4 depicts the high level architecture of the system which is composed of four layers.
Figure 4. System architecture
It is useful to think of an operator as a function op(arg1, arg2,...,). Since operators tend to be either unary or binary, they are utilised in more familiar forms: op arg1 (e.g. -12) or arg1 op arg2 (e.g. 1 + 1). In the context of the framework, arguments are typed, that is all the arguments must belong to some known domain. Thus, an operator can be classified according to the type of its operands: base array, MDA, and lattice. The base array is equivalent to the array constructs typically found in imperative programming languages such as C/C++, Java and Pascal. There are of course a huge number of possible operations that are useful in different applications, as well as particular classes of base arrays (e.g. 1-dimensional, 2-dimensional arrays). This leads to the introduction of a key aspect of the multidimensional data model: matrix operations. MDA operators are more closely related to database oriented operations. Some operations are closely affiliated with those in relational databases, whilst others are specific to the multidimensional database.
Common operations include:
OLAP operators roll up/drill down, slice/dice
and pivot.
Roll up (increasing the level of aggregation)
and drill down along one or more of the parameter hierarchies.
Slicing (selection, i.e. extracting a subset of
the database by range and constraints) and dicing (projection, i.e.
extracting only the relevant parameters).
Pivoting. Switching parameters to measures, and
vice-versa.
Restructuring operators
allows parameters to become measures and measures to become parameters:
fold and unfold.
Querying operators
MDA to be sliced, diced, classified and aggregated: selection, projection,
categorization, aggregation. There is also the CUBE and HCUBE,
which are an extension of the categorization and aggregation operators.
Joining operators
allows data to be combined in a variety of ways from two arrays: cartesian
product, join.
Set-theoretic operators:
union, difference and intersection.
In the more theoretical database references, many of these operators are described as a calculus or algebra, which are then implemented in an operational form as the more familiar SQL query:
SELECT (projection) (dimension hierarchy) (aggregation)
FROM
WHERE (selection)
GROUP BY (categorisation) CUBE ... HAVING (selection)
Each of these blocks return an MDA, and implies that if all these operators are well-defined then an MDA query language is at least as expressive as standard SQL.
Ahl, Valerie and Allen, T.F.H. "Hierarchy Theory: A Vision Vocabulary and Epistemology", Columbia University Press, 1996. ISBN: 0-231-08481-1.
Car, Adrijana. "Hierarchic Spatial Reasoning: a Geocomputation Method", Proceedings of Geocomputation ‘98.
Chaudhuri, S. Dayal, U. (1997), "An Overview of Data Warehousing and OLAP Technology". SIGMOD Record, 26(1):65- 74.
Codd, E.F., Codd, S.B. and Salley, C.T. (1993), "Providing OLAP to User-Analysts: An IT Mandate". White paper. Commissioned by Arbor Software Corporation. http://www.arborsoft.com/essbase.
Dickey, Thomas D., "Physical-Optical-Biological Scales Relevant to Recruitment in Large Marine Ecosystems", in Large Marine Ecosystems: Patterns, Processes and Yields", 169-178, Kenneth Sheraman, Lewis M. Alexander, Barry D. Gold (Editors), AAAS Press, Washington DC, USA, 1990/1992, ISBN: 0-87168-384-9.
Golledge, Reginald G., Montello, David R. "Scale and Detail in the Cognition of Geographic Information", Summary Report, 1998, http://www.ncgia.ucsb.edu/varenius/scale/SCALE_rpt.html
Gray, J., Chaudhuri, S., Bosworth, A., Layman, A., Reichart, D., Venkatrao, M., Pellow, F. and Pirahesh H. (1997), "Data cube: a relational aggregation operator generalizing group-by, cross-tab and sub-totals". Data Mining and Knowledge Discovery, 1(1):29- 53.
Gray, M. Violet. "Classification as an Impediment to the Reliable and Valid Use of Spatial Information: A Disaggregate Approach", Spatial Information Theory - A Theoretical Basis for GIS, LNCS 1329, Stephen C. Hirtle and Andrew U. Frank (Editors), Proceedings International Conference COSIT ‘97, Laurel Highlands, Pennsylvania, USA, October 1997, ISBN: 3-540-63623-4.
Harinarayan, V., Rajarman, A., and Ullman, J.D. (1996), "Implementing data cubes efficiently". In SIGMOD 96 [SIG96], pages 205- 216.
Hirtle, Stephen C. "Representational Structures for Cognitive Space: Trees, Ordered Trees, and Semi-Lattices", Spatial Information Theory - A Theoretical Basis for GIS, LNCS 988, Andrew Frank and Weiner Kuhn (Editors), Proceedings International Conference COSIT ‘95, Semmering, Austria, September 1995, Springer-Verlag, Berlin, ISBN: 3-540-60392-1.
Ho, C.T., Agrawal, R., Megiddo, N. and Srikant, R. (1997), "Range queries in OLAP data cubes", In SIGMOD 97 [SIG97], pages 73- 88.
Johnson, Alan R. "Spatiotemporal Hierarchies in Ecological Theory and Modeling", Environmental Modeling: Progress and Research Issues, Michael Goodchild, Bradley O. Parks, Louis Steyaert et al (Editors) 1996, GIS World Books, Fort Collins, USA. ISBN: 1-882610-11-3.
Kafatos, Menas. "Data access, querying, analysis and data mining in a distributed framework for earth system science support", Proceedings of GeoComputation99, 1999, http://www.geovista.psu.edu/geocomp/geocomp99/Gc99/022/gc_022.htm
Kineman, John J. "What is a Scientific Database? Design Considerations for Global Characterization in the NOAA-EPA Global Ecosystem Database Project", Enviromental Modeling with GIS, Michael F. Goodchild, Bradley O. Parks, Louis M. Steyaert (Editors) 1993, Oxford University Press, ISBN: 0-19-508807-6.
Kucera, Gail. "Pluralism in spatial information systems", Proceedings of Heocomputation 99, 1999, http://www.geovista.psu.edu/geocomp/geocomp99/Gc99/060/gc_060.htm
Lucas, Anne. "Representation of Variability in Marine Environmental Data", Marine and Coastal geographical Information Systems, Dawn Wright and Darius Bartlett (Editors), Taylor & Francis, London, 2000, ISBN: 0-7484-0862-2.
Pattee, Howard H. "The Phisical Basis and Origin of Hierarchical Control", (Editor) 1993, The International Library of Systems Theory and Philosophy (edited by Ervin Laszlo), George Braziller, New York, Standard Book Number: 0-8076-0674-X.
Simon, Herbert A. "The Organization of Complex Systems, Hierarchy Theory: The Challenge of Complex Systems", Howard H. Pattee (Editor) 1993, The International Library of Systems Theory and Philosophy (edited by Ervin Laszlo), George Braziller, New York, Standard Book Number: 0-8076-0674-X.
Stoms, D.M. Estes, J.E. "A remote sensing research agenda for mapping and monitoring biodiversity", International Journal of Remote Sensing, 1993, Vol.14, no.10, 1839-1860.
Stoms, David M., Davis, Frank W., Hollander, Allan D. "Hierarchical Representation of Species Distribution for Biological Survey and Monitoring", Environmental Modeling: Progress and Research Issues, Michael Goodchild, Bradley O. Parks, Louis Steyaert et al (Editors) 1996, GIS World Books, Fort Collins, USA. ISBN: 1-882610-11-3.
Timpf, Sabine. "Abstraction, Levels of Detail and Hierarchies in Map Series", Spatial Information Theory - Cognitive and Computational Foundations of Geographic Information Science, LNCS 1661, Christian Freksa and David Merk (Editors), Proceedings International Conference COSIT ‘99, Stade, Germany, August 1999, Springer-Verlag, Berlin, ISBN: 3-540-66365-7.
Timpf, Sabine. and Frank, Andrew U. "Using Hierarchical Spatial Data Structures for Hierarchical Spatial Reasoning", Spatial Information Theory - A Theoretical Basis for GIS, LNCS 1329, Stephen C. Hirtle and Andrew U. Frank (Editors), Proceedings International Conference COSIT ‘97, Laurel Highlands, Pennsylvania, USA, October 1997, ISBN: 3-540-63623-4.
Tobler, Waldo, "A resel-based GIS", Technical Communication, Int. J. Geographical Information Systems, 1995, Vol. 9, No. 1, 95-100.
Varma, Herman. "Applying Spatio-Temporal Concepts to Correlative Data Analysis", Marine and Coastal geographical Information Systems, Dawn Wright and Darius Bartlett (Editors), Taylor & Francis, London, 2000, ISBN: 0-7484-0862-2.
Zhao, Y., Deshpande, P.M. and Naughton, J.F. (1997), "An array-based algorithm for simultaneous multidimensional aggregates. In SIGMOD 97 [SIG97], pages 159- 170.